A student carries out an experiment to investigate how
the temperature of water increases with the time of heating. Diagram 1.1 shows
the set up of the apparatus for the investigation. Before the heater is
switched on the initial temperature, θ0
of the water is measured. Diagram 1.2 shows meniscus of the mercury column in
the thermometer.
Seorang
pelajar menjalankan satu eksperimen untuk menyiasat bagaimana suhu air bertambah dengan masa pemanasan. Rajah
1.1 menunjukkan susunan radas bagi penyiasatan itu. Sebelum pemanas dihidupkan,
suhu awal, θ0 bagi air itu diukur. Rajah 1.2 menunjukkan meniskus
bagi turus merkuri dalam termometer.
A stopwatch
and the heater is switched on simultaneously. At time, t = 20 s, the temperature, θ, of the water is read on the thermometer.
Diagram 2.3 shows the meniscus of the mercury column in the thermometer.
Sebuah jam
randik dan pemanas dihidupkan serentak. Pada masa, t = 20 s, suhu, θ, bagi air itu dibaca pada termometer. Rajah 1.3
menunjukkan meniskus bagi turus merkuri dalam termometer itu.
The
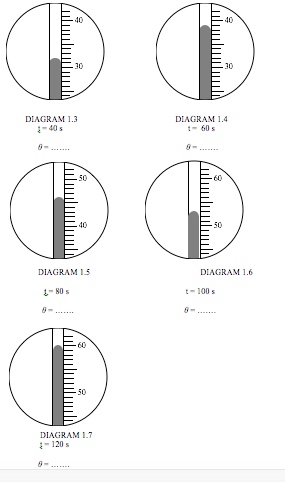
procedure is repeated for heating time, t = 40 s, 60 s, 80 s, 100 s and 120 s. The
corresponding positions of the meniscus of the mercury column in the
thermometer are shown in Diagrams 1.3, 1.4, 1.5, 1.6 and 1.7.
Procedure itu diulang bagi masa
pemanasan, t = 40 s, 60 s, 80 s, and 100
s. Kedudukan-kedudukan meniskus bagi turus merkuri dalam termometer adalah
seperti ditunjukkan dalam Rajah 1.4, 1.5, 1.6 and 1.7.
(a) For the experiment described above,
identify:
Bagi
experiment yang diterangkan di atas, kenal pasti
(i) the manipulated variable / pembolehubah dimanipulasikan
…………………………………………………………………………………
[1 mark]
(ii) the responding variable / pembolehubah bergerak balas
…………………………………………………………………………………
[1 mark]
(iii) a constant variable / pembolehubah dimalarkan
…………………………………………………………………………………
[1 mark]
(b) Explain how parallax error can be reduced
when the reading of the thermometer is taken.
Cadangkan bagaimana ralat paralaks boleh
dikurangkan apabila mengambil bacaan thermometer.
…..….……………………………………………………………………………….
[1
mark]
(c)(i) Based
on Diagram 1.2, determine the initial temperature, θ0, of the water.
Berdasarkan
Rajah 1.2, tentukan suhu awal, θ0, bagi air itu.
Initial temperature / suhu awal , θ0 = …………….
[1 mark]
(ii) Based on Diagrams 1.3, 1.4, 1.5, 1.6 and 1.7,
determine the temperature, θ, for the corresponding values of heating time, t.
Berdasarkan
Rajah 1.3, 1.4, 1.5, 1.6 dan 1.7,tentukan suhu θ, untuk setiap nilai
pemanasan dengan masa, t.
Δθ is the increase in temperature, Δθ
is calculated using the formula, 
Δθ ialah kenaikan suhu, Δθ dikira menggunakan formula .
.
Tabulate
your results for t, θ and Δθ in the space below.
Jadualkan keputusan bagi t, θ and Δθ dalam ruang
yang disediakan.
[5
marks]
(d) On
the graph paper on page 6, plot a graph of Δθ
against t.
Pada kertas
graf di halaman 6, lukis graf Δθ melawan t.
[5 marks]
(e) Based
on your graph, state the relationship between Δθ and t.
Berdasarkan graf anda, nyatakan hubungan
antara Δθ dan t.
…..….……………………………………………………………………………….
[1 mark]
Graph Δθ against t.
j
